Prediction of Conservation Reliant Species
Background
Global climate change will play a critical role in shaping future environments, and thus biodiversity. Key climate variables like temperature and precipitation will shift1,2, affecting species ranges, phenologies, and viability3-6. A changing world climate will likely lead to future environmental conditions unlike any currently experienced by species managed on US Department of Defense (DoD) lands. As a result, many species will become “conservation reliant”, requiring active management to prevent local, regional, and even global declines or extinction. Other species will be able to adapt to new conditions provided little or no management.

Objective
Our goal is to test empirical protocols and develop a theoretical framework for determining which species are likely to become reliant on active management as global climate change creates novel environments in and around DoD lands.
For this work we are focusing on a diverse suite of plant and animal species found across the US, including two "flagship" bird species and six "demonstration" species (see table below). The two flagship species have been extensively studied for over three decades, and are each actively managed on multiple DoD installations. For the six demonstration species, we are collecting demographic data across populations living in areas with a range of different climate conditions.
We are using demographic data on the species, current climate data, and climate projection models to
predict plausible future climate conditions faced by these species
determine how demographic rates are influenced by climate and how we might expect demographic rates to change under plausible future climate conditions
build and use Spatially Explicit Environmental Driver (SEED) population models to predict population changes in future environments
validate SEED model predictions in experimentally created conditions, and;
compare SEED model population dynamic predictions across species to determine ecological characteristics of conservation reliant vs. adaptive species.
For this study, IWS research ecologists are working in collaboration with researchers at Duke University, North Carolina State University, Virginia Tech University, and Point Blue Conservation Science. The study is part of an effort through the Strategic Environmental Research and Development Program (SERDP) to develop models for predicting habitat use and future conservation priorities of endangered and at-risk animal populations on active U.S. military installations and other DoD lands.
Evaluating the Use of Spatially Explicit Population Models to Predict Conservation Reliant Species in Non-analogue Future Environments on DoD Lands
Flagship Species
-

Western Snowy Plover
(Charadrius nivosus)
“The western snowy plover is a small wader in the plover bird family. It breeds in the southern and western United States and the Caribbean.”
-
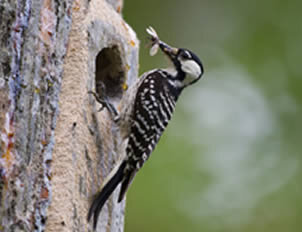
Red-cockaded woodpecker
(Leuconotopicus borealis)
Longleaf pine specialist found in the southeastern US. Federally listed as endangered.
Demonstration Species
-

Northern and California red-legged frogs
(Rana aurora and R. draytonii)
California red-legged frog found from southern to northern CA and federally listed as threatened. Northern red-legged frog found from northern CA to British Columbia.
-

Hydaspe fritillary butterfly
(Speyeria hydaspe)
Found throughout the western US in mid-elevation conifer forests and meadows. Closely related to the threatened Oregon silverspot butterfly.
-

Appalachian brown butterfly
(Satyrodes appalachia)
Found throughout the eastern US in wooded wetland and riparian habitats. Related to the endangered Saint Francis satyr butterfly.
-

Venus flytrap
(Dionaea muscipula)
Rare carnivorous plant native only in the coastal plains of North and South Carolina but introduced in other states including Florida and New Jersey.
-

Alaskan douglasia
(Douglasia alaskana)
Rare plant found only on high elevation talus slopes in Alaska and the Yukon Territory.
Study locations by species:

Measuring demographic rates:
We employ a variety of methods to measure demographic rates of the demonstration species in the field and under experimental conditions.
For the plants we track individuals in the field to measure survival, growth, and seed production. We also grow plants in greenhouses to explore the effects of different levels of nutrient and water availability.

Marked Venus flytrap individuals in experimental plots
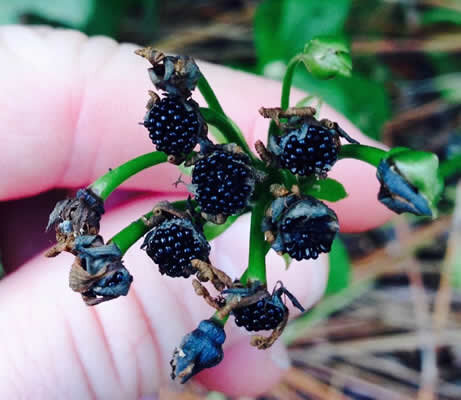
seed heads from a Venus flytrap
For the butterflies we measure adult survival using mark recapture methods and larval survival by rearing caterpillars in cages in the field or in greenhouses with controlled climate conditions. We measure egg production rate (fecundity) and hatching success by caging females and eggs.

Marked adult hydaspe fritillary

female hydaspe in egg laying container

larval hydaspe feeding on violet leaves

experimental warming set up for Appalachian brown larval rearing study
For the frogs we measure tadpole, juvenile, and adult survival using mark recapture methods, fecundity by counting the number of eggs per mass from photos, and egg hatching success using cages. We also measure tadpole survival under elevated temperatures and faster pond drying rates through cattle tank experiments.
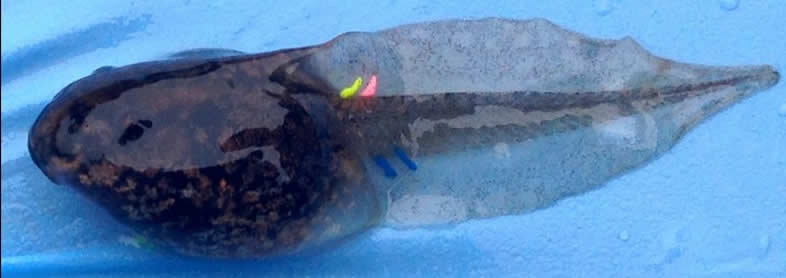
Red-legged frog tadpole marked with visible implant elastomer (VIE) tags

egg hatching cages
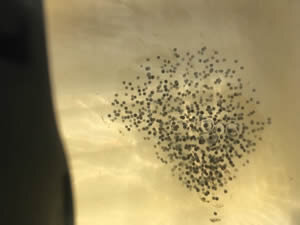
red-legged frog egg mass
Technical Approach
The main technical tool in this project, SEED models, are next-generation population models that link demographic rates to environmental variables across real landscapes. The models incorporate dispersal of individual organisms between habitat patches to gauge the population consequences of landscape changes in both space and time.
We are also developing an index of susceptibility that integrates the direction and magnitude of climate effects on demographic rates and the sensitivity of population growth rates to changes in each demographic rate throughout a species' life cycle.
Results: relationships between climate variables and demographic rates
Venus flytrap
When water inputs are lower than normal (simulated drought conditions), Venus flytraps exhibit reduced growth rates. Under normal precipitation conditions adding nitrogen increases growth rates. However, under drought conditions, nitrogen addition does not affect growth rates.

Venus flytrap growth rates under ambient (normal) precipitation levels and two levels of drought conditions (low and very low water). The black line depicts growth rates with normal soil nitrogen levels, and the blue line depicts growth rates when extra nitrogen is added.
Appalachian brown butterfly
Adult Appalachian brown survival does not appear to be affected by temperature. However, the number of eggs laid (fecundity) and egg hatching success drop off at high temperatures in greenhouse experiments.
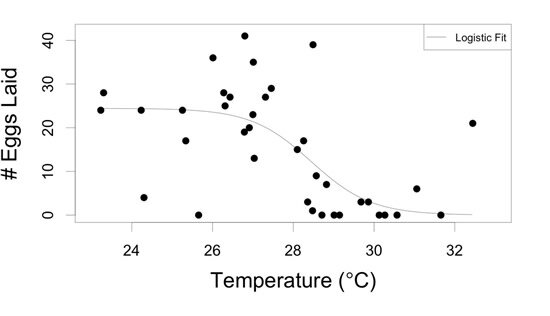
The number of eggs laid by Appalachian Brown butterflies drops off dramatically for temperatures above ~28 °C

The proportion of eggs that successfully hatch declines with increasing temperature
Hydaspe fritillary butterfly
Like the Appalachian brown, hydaspe fritillary adult survival is not influenced by temperature. However, climate does influence hydaspe phenology. The start of the adult flight period (period of time between first adult emergence and last adult death each season) is correlated with growing degree days, a measure of heat accumulation throughout the spring while caterpillars are developing. The length of the flight period is influenced by both precipitation and temperature. Drier and warmer conditions lead to shorter flight periods, which is likely the result of nectar plants that adults rely on for food senescing earlier in the year. The effects of different climate variables on fecundity and egg hatching success are more complex and we are still in the process of analyzing results. However, we have found that eggs develop more quickly under warmer conditions.

Development rates of hydaspe fritillary eggs are faster (fewer days to hatching) as temperatures increase.

Adult hydaspe flight periods start earlier when growing degree-days are higher (right). Higher growing degree-days indicate warmer temperatures during the spring and early summer while caterpillars are developing.
Red-legged frogs
Both temperature and precipitation affect the demographic rates of red-legged frogs. Greater precipitation in the previous year leads to higher fecundity (number of eggs/mass). Warmer temperatures speed up egg development rates and reduce egg hatching success, but they also increase tadpole survival rates. Other habitat characteristics can also influence tadpole survival. At some sites we found that tadpole survival is greater when tadpoles live in shaded areas of ponds with greater tree canopy cover. The difference in tadpole survival between shaded and unshaded environments at these sites is large enough to influence population growth rates.

Egg development rates are faster (days to hatching fewer) as temperatures increase. Black points represent Northern red-legged frog populations in Oregon, red points represent Northern red-legged frog populations in California, and blue points represent California red-legged frog populations.

Egg mortality rates increase with temperature. Black points represent Northern red-legged frog populations in Oregon, red points represent Northern red-legged frog populations in California, and blue points represent California red-legged frog populations.

Tadpole survival is higher in shaded (high canopy cover) environments…

…and this difference in tadpole survival ultimately leads to significantly higher population growth rates
Snowy plovers and red-cockaded woodpeckers
The effects of climate on the demographic rates of our two bird species can be complex. For example, the best predictor of survival of adult snowy plovers is the number of consecutive days below a certain temperature threshold. For red-cockaded woodpeckers the same climate variable can have contrasting effects depending on the time of year and the life stage of interest. Winter precipitation has positive effects on the probability of initiating nests, while spring precipitation reduces nesting probability.
Next Steps
We are now working on our next step: building and testing SEED models based on our existing data to bring greater spatial accuracy and predictive power to informed management decisions.
Upon completion, this study will provide a set of tools that will assist DoD land managers to anticipate future management needs as a result of global climate change.
Literature Cited
1. Girvetz, E. H., Zganjar, C., Raber, G. T., Maurer, E. P., Kareiva, P., & Lawler, J. J. 2009. Applied climate-change analysis: the climate wizard tool. PLoS One 4: e8320.
2. IPCC, 2013: Summary for Policymakers. In: Climate Change 2013: The Physical Science Basis. Contribution of Working Group I to the Fifth Assessment Report of the Intergovernmental Panel On Climate Change [Stocker, T.F., D. Qin, G.-K. Plattner, M. Tignor, S. K. Allen, J. Boschung, A. Nauels, Y. Xia, V. Bex and P.M. Midgley (eds.)]. Cambridge University Press, Cambridge, United Kingdom and New York, NY, USA.
3. Parmesan, C., Ryrholm, N., Stefanescu, C., Hill, J. K., Thomas, C. D., Descimon, H., & Warren, M. 1999. Poleward shifts in geographical ranges of butterfly species associated with regional warming. Nature, 399: 579-583.
4. Deutsch, C. A., J. J. Tewksbury, et al. 2008. Impacts of climate warming on terrestrial ectotherms across latitude. Proceedings of the National Academy of Sciences of the United States of America 105: 6668-6672.
5. Chen, I. C., Hill, J. K., Ohlemüller, R., Roy, D. B., & Thomas, C. D. 2011. Rapid range shifts of species associated with high levels of climate warming. Science 333: 1024-1026.
6. Urban, M.C., Bocedi, G., Hendry, A.P., Mihoub, J.B., Pe’er, G., Singer, A., Bridle, J.R., Crozier, L.G., De Meester, L., Godsoe, W. and Gonzalez, A. 2016. Improving the forecast for biodiversity under climate change. Science 353: p.aad8466.
Visit our other SERDP sponsored projects:
Photo credits:
California red-legged frog, hydaspe fritillary butterfly, and western snowy plover - Brian Hudgens
northern red-legged frog, and hydaspe fritillary in slideshow - Walter Siegmund (cropped)
red-cockaded woodpecker in background - USFWS Southwest (cropped/stretched)